Protocols
This page details what protocols and procedures can be used for some basic TI hardware testing.
- Testing Stimulator Current Output
- Testing Stimulator Channel Isolation
- Testing Intermodulation Distortion
- Choosing Resistance Values
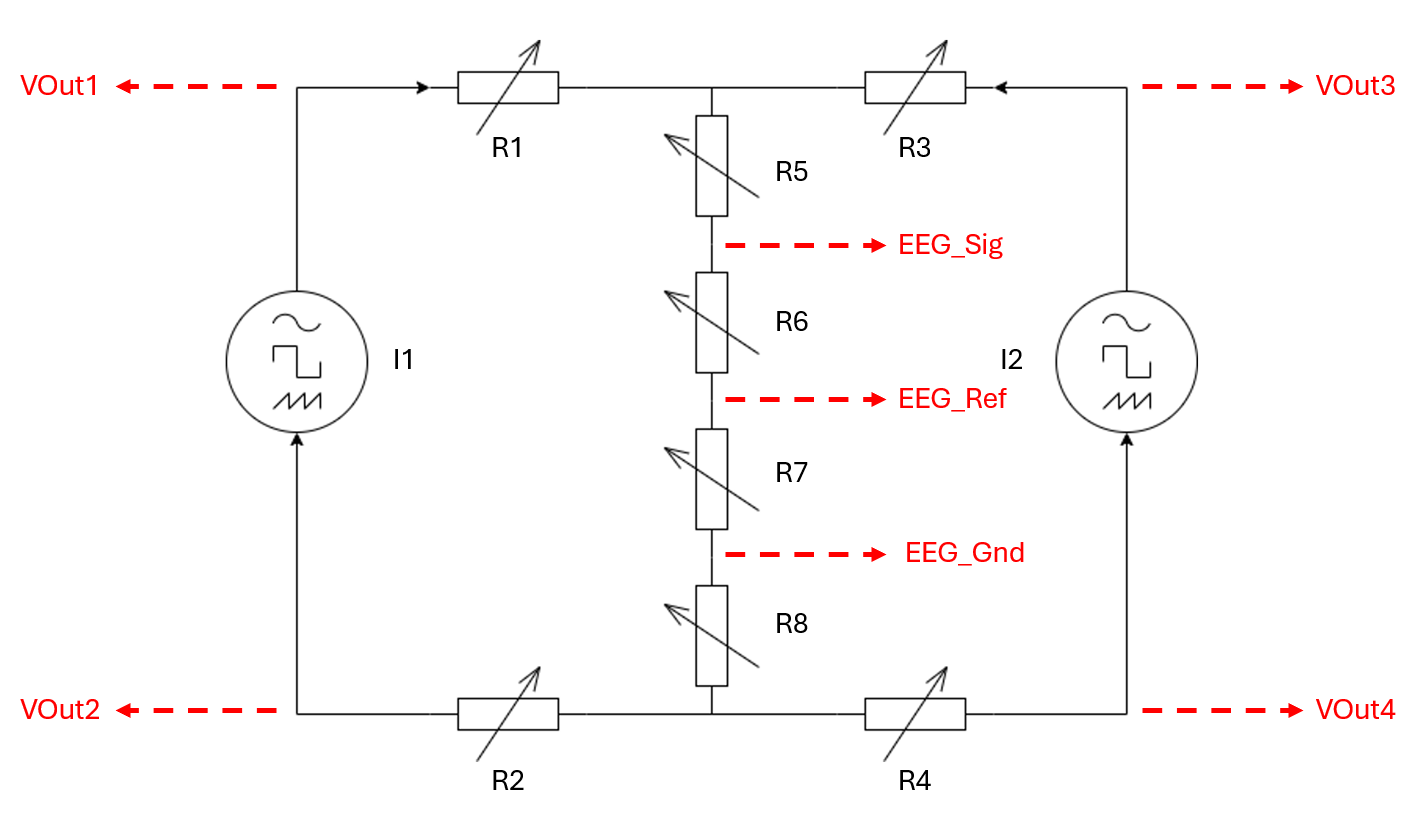
Note that the test load used throughout these protocols is a resistive network in a H-Bridge topology. An understanding of Ohm’s Law is recommended.
The exact resistor values to be used should be determined according to the electrode montage to be used in human experiments and observed impedances there. The guide for this process is below.
This document will make reference to the following variables:
| Label | Type | Unit | Detail |
|---|---|---|---|
| f | Frequency | Hz | The carrier frequency for Temporal Interference to be defined by the tester for their respective experiment objectives |
| I1 | Current | mA | The current amplitude for Temporal Interference channel 1, to be defined by the tester for their respective experiment objectives |
| I2 | Current | mA | The current amplitude for Temporal Interference channel 2, to be defined by the tester for their respective experiment objectives |
| Rsum | Resistance | Ohms | The sum of the impedance magnitudes for all impedances in R5, R6, R7 and R8. |
Testing Stimulator Current Output
The tester should test each TI channel independently for this test, i.e. if channel 1 is outputting current, then channel 2 should be switched off - and vice versa.
Procedure - Comparing Actual Current Amplitude to Programmed Current Amplitude
This test procedure covers to how to verify the actual current amplitude matches the programmed current amplitude of the stimulator.
- Connect the active and return of TI channel 1 to the left side of the resistive network.
- Connect the active and return of TI channel 2 to the right side of the resistive network.
- Program the stimulator channel 1 to output with frequency f, amplitude I1; and stimulator channel 2 to output with amplitude 0mA.
- Connect an oscilloscope or DAQ probe across R2 (note - make sure the DAQ or scope is taking a differential voltage reading and not referring the BNC inner conductor potential to the instrument’s ground potential).
- Record the amplitude (0 to peak) voltage value, and divide this by the resistance value of R2. Compare the resulting value to the programmed current amplitude.
- Program the stimulator channel 1 to output with amplitude 0mA; and stimulator channel 2 to output with frequency f amplitude I2.
- Connect an oscilloscope or DAQ probe across R4 (note - make sure the DAQ or scope is taking a differential voltage reading and not referring the BNC inner conductor potential to the instrument’s ground potential).
- Record the amplitude (0 to peak) voltage value, and divide this by the resistance value of R4. Compare the resulting value to the programmed current amplitude.
Analysing the output of steps 5 and 8, ensure that the programmed current amplitudes is acceptably close to the actual current amplitudes. A non-negligble mismatch indicates a hardware fault, or connection issue.
Procedure - Assessing Frequency Response of Stimulator Output
This test procudure covers how to verify the stimulation frequency is within the capability of the stimulator used. Example starting frequency of 1kHz is used here and the range of testing frequencies is not defined - it is up to the tester to determine which frequencies are of interest to their use cases.
- Connect the active and return of TI channel 1 to the left side of the resistive network.
- Connect the active and return of TI channel 2 to the right side of the resistive network.
- Program the stimulator to output at amplitude I1 on channel 1 and 0mA on channel 2. Program the frequency of the waveform on channel 1 to 1kHz (just an example starting point).
- Connect an oscilloscope or DAQ probe across R2 (note - make sure the DAQ or scope is taking a differential voltage reading and not referring the BNC inner conductor potential to the instrument’s ground potential).
- Record the amplitude (0 to peak) voltage value, and divide this by the resistance value of R2 (Ohm’s Law).
- Repeat steps 3 to 5, varying the frequency of channel oscillation. Record the output of step 5 for each frequency value, i.e. the voltage amplitude at R2 divided by R2 resistance in Ohms each time.
- For each recording, do a Decibel transformation 10*log10(V). The decibel transformation will allow better visualisation of the frequency response, where 0dB means there is no loss in amplitude for the corresponding frequency.
- Program the stimulator to output 0mA on channel 1 and I2 on channel 2. Program the frequency of the waveform on channel 2 to 1kHz.
- Connect an oscilloscope or DAQ probe across R4 (note - make sure the DAQ or scope is taking a differential voltage reading and not referring the BNC inner conductor potential to the instrument’s ground potential).
- Record the amplitude (0 to peak) voltage value, and divide this by R4 resistance in Ohms (Ohm’s Law).
- Repeat steps 8 to 10, varying the frequency of channel oscillation. Record the output of step 10 for each frequency value, i.e. the voltage amplitude at R4 divided by R4 resistance in Ohms each time.
- For each recording, do a Decibel transformation 10*log10(V). The decibel transformation will allow better visualisation of the frequency response, where 0dB means there is no loss in amplitude for the corresponding frequency.
Analysing the output of steps 7 and 12, ensure that the attenuation (if any) at the Temporal Interference carrier frequencies to be used in human-experiments is acceptable. If the attenuation is non-negligble, consult the datasheet of the stimulator in use to ensure the frequency is within the advertised output bandwidth. If it is within the advertised bandwidth, non-neglible attenuation indicates a hardware-fault or connection issue.
Testing Stimulator Channel Isolation
This test procedure covers how to verify the current waveforms being delivered by each channel of the stimulator are isolated from eachother at the source.
- Connect the active and return of TI channel 1 to the left side of the resistive network.
- Connect the active and return of TI channel 2 to the right side of the resistive network.
- Program the stimulator channel 1 to output with frequency f, amplitude I1; and stimulator channel 2 to output with amplitude frequency f+df, amplitude I2.
- Connect an oscilloscope or DAQ probe to the voltage across the output of the current source 1, VOut1 referred to VOut2 (note - make sure the DAQ or scope is taking a differential voltage reading and not referring the BNC inner conductor potential to the instrument’s ground potential). The tester should observe a waveform with amplitude modulation index: I2*(Rsum)/(I1*(Rsum+R1+R2)).
- Connect an oscilloscope or DAQ probe to the voltage across the output of the current source 2, VOut3 referred to VOut4 (note - make sure the DAQ or scope is taking a differential voltage reading and not referring the BNC inner conductor potential to the instrument’s ground potential - nor short-circuiting the outer conductor of the BNC to the outer conductor of any other connected BNC). The tester should observe a waveform with amplitude modulation index: I1*(Rsum)/(I2*(Rsum+R3+R4)).
- Connect an oscilloscope or DAQ probe across R2 (note - make sure the DAQ or scope is taking a differential voltage reading and not referring the BNC inner conductor potential to the instrument’s ground potential). The tester should observe a waveform with 0% amplitude modulation.
- Connect an oscilloscope or DAQ probe across R4 (note - make sure the DAQ or scope is taking a differential voltage reading and not referring the BNC inner conductor potential to the instrument’s ground potential). The tester should observe a waveform with 0% amplitude modulation.
- onnect an oscilloscope or DAQ probe across R7 (note - make sure the DAQ or scope is taking a differential voltage reading and not referring the BNC inner conductor potential to the instrument’s ground potential - nor short-circuiting the outer conductor of the BNC to the outer conductor of any other connected BNC). The tester should observe a waveform with 100% amplitude modulation, with an envelope oscillating at df Hz.
Note that if the output of either step 6 or step 7 was not a waveform with 0% amplitude modulation, then the current sources are not adequately isolated, indicating a hardware fault or connection error. The results of steps 4,5 and 8 will indicate which current source channel is problematic.
Testing Intermodulation Distortion
Recording instrumentation (EEG or DAQ; with or without filters) is required for performing this test; and any dedicated filters that are to be used at the interface to the instrumentation.
This test procedure covers how to test for presence of intermodulation distortion in the stimulator or the recording filter/amplifier.
- Connect the active and return of TI channel 1 to the left side of the resistive network.
- Connect the active and return of TI channel 2 to the right side of the resistive network.
- Program the stimulator channel 1 to output with frequency f, amplitude I1; and stimulator channel 2 to output with amplitude frequency f+df, amplitude I2.
- Connect an oscilloscope or DAQ to probe across the sum of R6 and R7 (EEG_Sig referred to EEG_Gnd) (note - make sure the DAQ or scope is taking a differential voltage reading and not referring the BNC inner conductor potential to the instrument’s ground potential).
- Connect an oscilloscope or DAQ to probe across the sum of R7 (EEG_Ref referred to EEG_Gnd) (note - make sure the DAQ or scope is taking a differential voltage reading and not referring the BNC inner conductor potential to the instrument’s ground potential).
- Manually ensure that the maximum voltage amplitude observed on either voltage probe is within the safe input range for the recording instrumentation. Record maximum voltage amplitudes for EEG_Ref and EEG_Sig, both referred to EEG_Gnd.
- If the previous step is satisfied (and if using an EEG amplifier for recording instrumentation), connect the 1.5mm Touchproof EEG connectors to the voltage probe points on the resistive network (EEG_Sig, EEG_Ref and EEG_Gnd) to the corresponding inputs of the EEG recording instrumentation: 1x Signal, 1x Reference and 1x GND. Disconnect the scope or DAQ probes, if still connected.
- Connect an oscilloscope or DAQ to the output voltage of current source 1 (VOut1 referred to VOut2) (note - make sure the DAQ or scope is taking a differential voltage reading and not referring the BNC inner conductor potential to the instrument’s ground potential). Record the observed maximum voltage amplitude.
- Connect an oscilloscope or DAQ to the output voltage of current source 2 (VOut3 referred to VOut4) (note - make sure the DAQ or scope is taking a differential voltage reading and not referring the BNC inner conductor potential to the instrument’s ground potential). Record the observed maximum voltage amplitude.
- Disconnect all scope or DAQ probes from the resistive network, leaving only EEG recording points on the resistive network connected to the EEG recording instrumentation (if using EEG amplifier as recording instrumentation.
- While the stimulation is still active, record a timeseries for ~4 minutes. Analyse the recorded data in the frequency domain, using the Fourier Transform. MATLAB function documentation here.
- Analyse the frequency spectral content at df Hz (which is the difference in Hz between each carriers; f Hz and f+df Hz).
If there is no spectral content at df Hz (at least no peak above the noise floor), then all hardware (stimulator, filters, amplifiers) are in linear regions of operation and there is no intermodulation distortion for these voltage parameters. It is critical to remember that different voltage parameters (as recorded in steps 6, 8 and 9) will move hardware to different regions of linearity and intermodulation distortion contribution will vary. It is therefore important to choose impedance magnitudes on the PCB that correspond to voltage parameters that are observed on the scalp for a given electrode configuration.
If there is spectral content at df Hz (a peak above the noise floor), then at least one piece of hardware is a non-linear region of operation and is contaminating the recording with intermodulation distortion. The tester must ensure that the magnitude of the distortion is below relevant noise floors, i.e. of the recording instrumentation or biological. Alternatively, ensure that the contaminated frequency bins are of no use in the analysis of the recorded signals.
Determining which hardware component is contributing the intermodulation distortion can be done by repeating the procedure with varying impedance values. R5, R6, R7 and R8 can all be varied such that the voltage amplitudes at stimulator output (VOut1-VOut2, VOut3-VOut4) can be varied while keeping the same voltage input to recording instrumentation (EEG_Sig, EEG_Ref and EEG_Gnd). The opposite is also true - voltage amplitudes at stimulator output can be kept stationary while varying voltage input to recording instrumentation. For example, increasing the impedance in R5 and R8 will increase the stimulator output voltage, without changing the voltage input to the EEG recording instrumentation. In contrast, increasing the impedance in either R6 or R7 will vary the voltage input to the EEG recording instrumentation, and stimulator output voltage can be kept the same by appropriately attenuating the impedances in R5 and R8 such that the sum of impedances is overall the same.
Choosing Resistor Values
The process for determining which physical electrode locations should be used for stimulation/recording is to be determined by the research and/or lab for their study’s objectives.
Stimulation electrodes (1x active and 1x return per waveform, 4 electrodes total) should be placed on the scalp of a human participant. EEG electrodes should be placed on the scalp for EEG reference and ground. One more EEG electrode should be selected for probing. There should be seven total electrodes on the scalp at least.
Temporal Interference stimulation should be powered on for both channels at the carrier frequencies as defined in a given lab’s particular study objective(s). The current amplitude should be set to the target value to be used, again, as defined in a given lab’s particular study objective(s). It is critical that the set current in Amps and set frequency in Hertz are maintained when testing resulting impedance magnitudes on the PCB.
While stimulation is active, using a DAQ or oscilloscope, the following parameters should be recorded:
- Potential difference envelope (V) between the active and return electrodes for TI waveform 1 (VOut1 referred to VOut2), maximum voltage and amplitude modulation index.
- Potential difference envelope (V) between the active and return electrodes for TI waveform 2 (VOut3 referred to VOut4), maximum voltage and amplitude modulation index.
- Amplitude Modulation Index of VOut1 referred to VOut2 and VOut3 referred to VOut4 respectively.
- Maximum potential difference (V) between EEG Signal and EEG Ground (EEG_Sig)
- Maximum potential difference (V) between EEG Reference and EEG Ground (EEG_Ref)
These four parameters should be recorded across a variety of human participants (with the same electrode locations) to capture an understanding of variation. These parameters will determine the target voltage parameters when defining impedance values to use in the PCB.
R6 and R7 are used to tune voltage amplitudes for EEG_Sig and EEG_Ref. Divide the maximum measured EEG Signal voltage by the sum of both delivered current amplitudes to derive the resistance that is R6 and R7. Divide the maximum measured EEG Reference voltage by the sum of both delivered current amplitudes to derive the resistance that is R7 alone. R6 can be then be derived by subtracting R7 from (R6+R7).
- The sum of R5+R6+R7+R8 defines the total ‘common impedance’ which both current source outputs see. This will affect the amplitude modulation index of each output voltage (VOut1 referred to VOut2, and VOut3 referred to VOut 4).
- (R1+R2+R5+R6+R7+R8) should be determined such as to match the total impedance magnitude seen by current source 1.
- (R3+R4+R5+R6+R7+R8) should be determined such as to match the total impedance magnitude seen by current source 2.
- (R5+R6+R7+R8)/(R1+R2+R5+R6+R7+R8) should be determined such as to match amplitude modulation index observed at the voltage output of current source 1 (VOut1 referred to VOut2).
- (R5+R6+R7+R8)/(R3+R4+R5+R6+R7+R8) should be determined such as to match amplitude modulation index observed at the voltage output of current source 2 (VOut3 referred to VOut4).
Example
Both TI currents are connected to the head at the appropriate locations. They both output at 2mA. EEG Signal, Reference and Ground and placed on the head at the appropriate locations. Both TI Currents are activated.
- The voltage observed between EEG Signal and EEG Ground has a maximum measurement of 200mV.
- The voltage observed between EEG Signal and EEG Ground has a maximum measurement of 20mV.
- The voltage envelope observed between VOut1 and VOut2 oscillates around 4.05V, reaching maximum of 4.25V (~5% AMI).
- The voltage envelope observed between VOut3 and VOut4 oscillates around 4.45V, reaching maximum of 4.65V (~4.5% AMI).
- 200mV divided by 4mA is 50 Ohms. R6+R7 must sum to 50 Ohms.
- 20mV divided by 4mA is 5 Ohms. R7 is 5Ohms. R6 is 45 Ohms.
- 4.05V divided by 2mA is 2.025 kOhms. (R1+R2+R5+R6+R7+R8) must be 2.025 kOhms.
- 4.45 divided by 2mA is 2.225 kOhms. (R3+R4+R5+R6+R7+R8) must be 2.225 kOhms.
- 2.225 kOhms multiplied by 0.045 is 100.125 Ohms. 2.025 kOhms multiplied by 0.05 is 101.25 Ohms. Average is ~101 Ohms, (R5+R6+R7+R8) must be 101 Ohms.
- R6+R7 is 50 Ohms (step 1), R5+R8 must be 51 Ohms. Divide equally for R5 and R8 equal to 25.5 Ohms each.
- (R1+R2+R5+R6+R7+R8) must be 2.025 kOhms (step 3). (R5+R6+R7+R8) must be 101 Ohms (step 5). R1+R2 must be 1924, divide equally for R1 and R2 equal to 962 Ohms each.
- (R3+R4+R5+R6+R7+R8) must be 2.225 kOhms (step 4). (R5+R6+R7+R8) must be 101 Ohms (step 5). R3+R4 must be 2124, divide equally for R1 and R2 equal to 1062 Ohms each.